A hardware engineer’s look at the data pipeline nobody audits
When a pharmaceutical distributor loses a $35,000 shipment to a temperature excursion, the post-mortem usually blames one of two things: the refrigeration unit failed, or someone left the door open too long.
Rarely does anyone audit the data pipeline — the chain of events between “sensor detects temperature rise” and “operator receives alert and takes action.”
That pipeline is where cold chains actually break. Not at the sensor. Not at the refrigeration unit. In the latency between detection and response.
I want to walk through that pipeline in detail, because I think it reveals something important about how we evaluate vehicle tracking and monitoring hardware — and why the spec sheet metrics everyone focuses on (GPS accuracy, battery life, waterproof rating) are the wrong metrics for cold chain applications.
The Pipeline
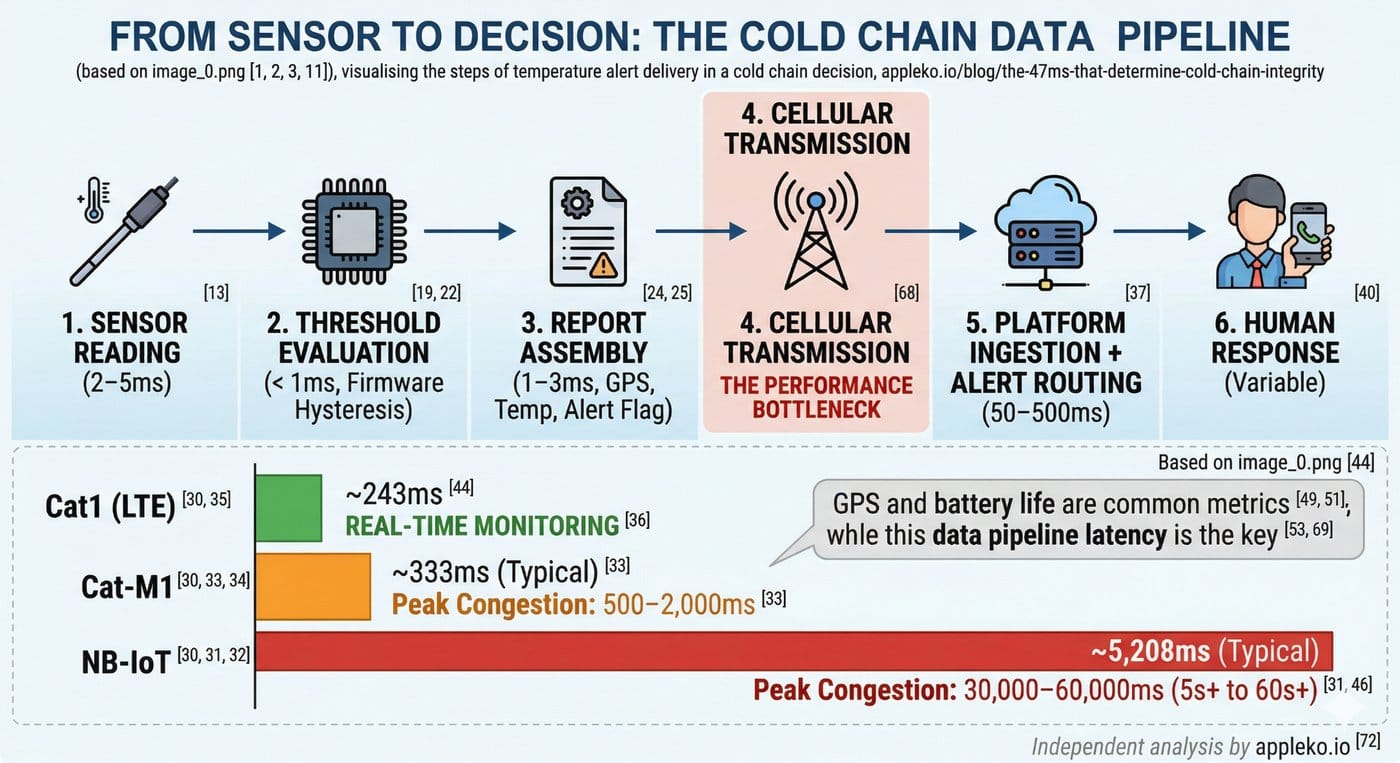
Here is every step between “cargo temperature exceeds threshold” and “someone does something about it”:
Step 1: Sensor Reading (2–5ms)
The temperature probe — typically an NTC thermistor or RTD element — produces an analog voltage proportional to temperature. The tracker’s ADC (analog-to-digital converter) samples this voltage. At 12-bit resolution with a 1V reference, the quantization step is about 0.24 mV — sufficient for ±0.5°C accuracy.
For ultra-cold applications (frozen goods, biological samples), PT1000 RTD probes provide better linearity and accuracy at extreme temperatures. The TK417’s analog input circuit is designed to read PT1000 probes directly, without an external signal conditioning board.
This step is essentially instantaneous — limited only by the ADC sample rate (typically 10–100 kHz).
Step 2: Threshold Evaluation (< 1ms)
The tracker’s firmware compares the reading against a pre-configured threshold. This is a simple integer comparison — trivial for even the simplest microcontroller.
But here’s the nuance: good firmware implements hysteresis (e.g., trigger at 8.0°C, clear at 6.5°C) to prevent alert flapping when the temperature oscillates around the threshold. Bad firmware doesn’t. The result of bad firmware is an operator who ignores temperature alerts because they fire and clear every 30 seconds during normal operation.
Step 3: Report Assembly (1–3ms)
The firmware assembles a data packet containing GPS position, timestamp, temperature reading, alert flag, and any additional sensor data (humidity, BLE beacon scans). For the Eelink 2.0 protocol, this packet is typically 200–400 bytes.
Step 4: Cellular Transmission (15–2,000ms)
← THIS IS WHERE THE VARIANCE LIVES
This is the step that determines everything. And it’s entirely dependent on the cellular technology.
|
Technology |
Typical TX Latency |
Peak Congestion Latency |
|
Cat1 (LTE) |
15–50ms |
100–200ms |
|
Cat-M1 |
50–200ms |
500–2,000ms |
|
NB-IoT |
1,500–10,000ms |
30,000–60,000ms |
Read that NB-IoT number again. Under network congestion, an NB-IoT device can take 30–60 seconds to deliver an alert. For a temperature excursion in a pharmaceutical shipment, 60 seconds of additional latency might be the difference between “operator adjusts refrigeration” and “operator discovers the shipment is already compromised.”
Cat-M1 is better — but during peak network hours, 500ms–2 second latency is common. And Cat-M1 traffic may be deprioritized by the carrier during congestion.
Cat1 delivers the same latency performance as any smartphone on the network. 15–50ms typical, 100–200ms worst case. This is the performance that “real-time monitoring” actually requires.
Step 5: Platform Ingestion + Alert Routing (50–500ms)
The tracking platform receives the packet, parses it, evaluates alert rules, and dispatches notifications (push, SMS, email, webhook). This latency depends on the platform architecture and notification service, but 50–500ms is typical for well-built systems.
Step 6: Human Response (variable)
The operator sees the alert and decides what to do. This is outside the hardware pipeline, but it’s worth noting: if the alert arrives 30 seconds late (NB-IoT under congestion), the operator is making decisions about a situation that may have already escalated.
End-to-End Latency
|
Pipeline Stage |
Cat1 |
Cat-M1 |
NB-IoT |
|
Sensor + Firmware |
~8ms |
~8ms |
~8ms |
|
Cellular TX |
~35ms |
~125ms |
~5,000ms |
|
Platform + Alert |
~200ms |
~200ms |
~200ms |
|
Total |
~243ms |
~333ms |
~5,208ms |
The Cat1 pipeline delivers an alert to the operator in under 250 milliseconds. The NB-IoT pipeline takes over 5 seconds — and up to 60 seconds under congestion.
Why This Matters More Than GPS Accuracy
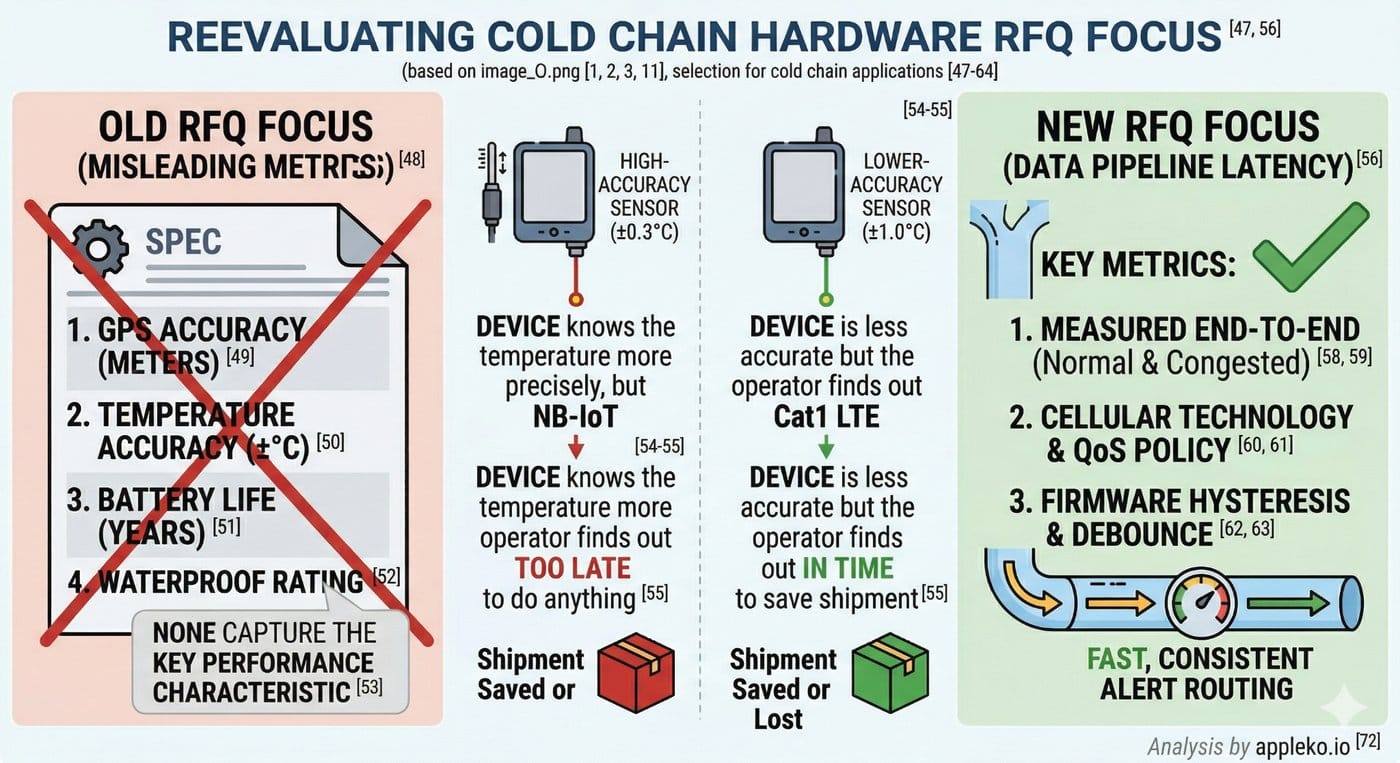
When fleet operators evaluate tracking hardware for cold chain applications, the RFQ typically focuses on:
• GPS accuracy (meters)
• Temperature accuracy (±°C)
• Battery life (years)
• Waterproof rating (IP6x)
None of these metrics capture the most important performance characteristic for cold chain: end-to-end alert latency.
A device with ±0.3°C temperature accuracy and 5-second alert latency is worse for cold chain than a device with ±1.0°C accuracy and 250-millisecond latency. The first device knows the temperature more precisely, but the operator finds out too late to do anything about it.
What I’d Ask in an RFQ
If I were evaluating tracking hardware for cold chain applications, I would add three questions to every RFQ:
1. What is the measured end-to-end latency from sensor reading to platform alert, under both normal and congested network conditions? (Not the theoretical spec — the measured value from a live deployment.)
2. What cellular technology does the device use, and what is the carrier’s QoS policy for that technology in the deployment region? (Cat-M1 QoS policies vary by carrier. Ask for specifics.)
3. Does the firmware implement hysteresis and debounce on temperature alerts? (If the vendor doesn’t understand the question, the firmware probably doesn’t implement it.)
The answers to these three questions will tell you more about cold chain performance than any spec sheet.
The Unsexy Truth
Cold chain integrity isn’t about the sensor. It’s about the pipe.
A $30 temperature probe with ±1°C accuracy is more than sufficient for most cold chain applications. The performance bottleneck is almost always in the cellular transmission layer — the 15ms to 60,000ms range that separates Cat1 from NB-IoT under real-world conditions.
When evaluating hardware for temperature-sensitive transport, focus less on the sensor specifications and more on the data pipeline latency. That’s where shipments are saved or lost.
Apple Ko writes about IoT hardware engineering and fleet telematics from Shenzhen.
Independent analysis — not sponsored content. → appleko.io